Monitor hub
One board for every project my coding agents work on: what failed, what’s waiting on me, and what’s running where.
- Status
- Ongoing
- Views
- Web board, and a terminal console on a wall monitor
- Console
- Python · Textual
- History
- 2026
In this project
Overview
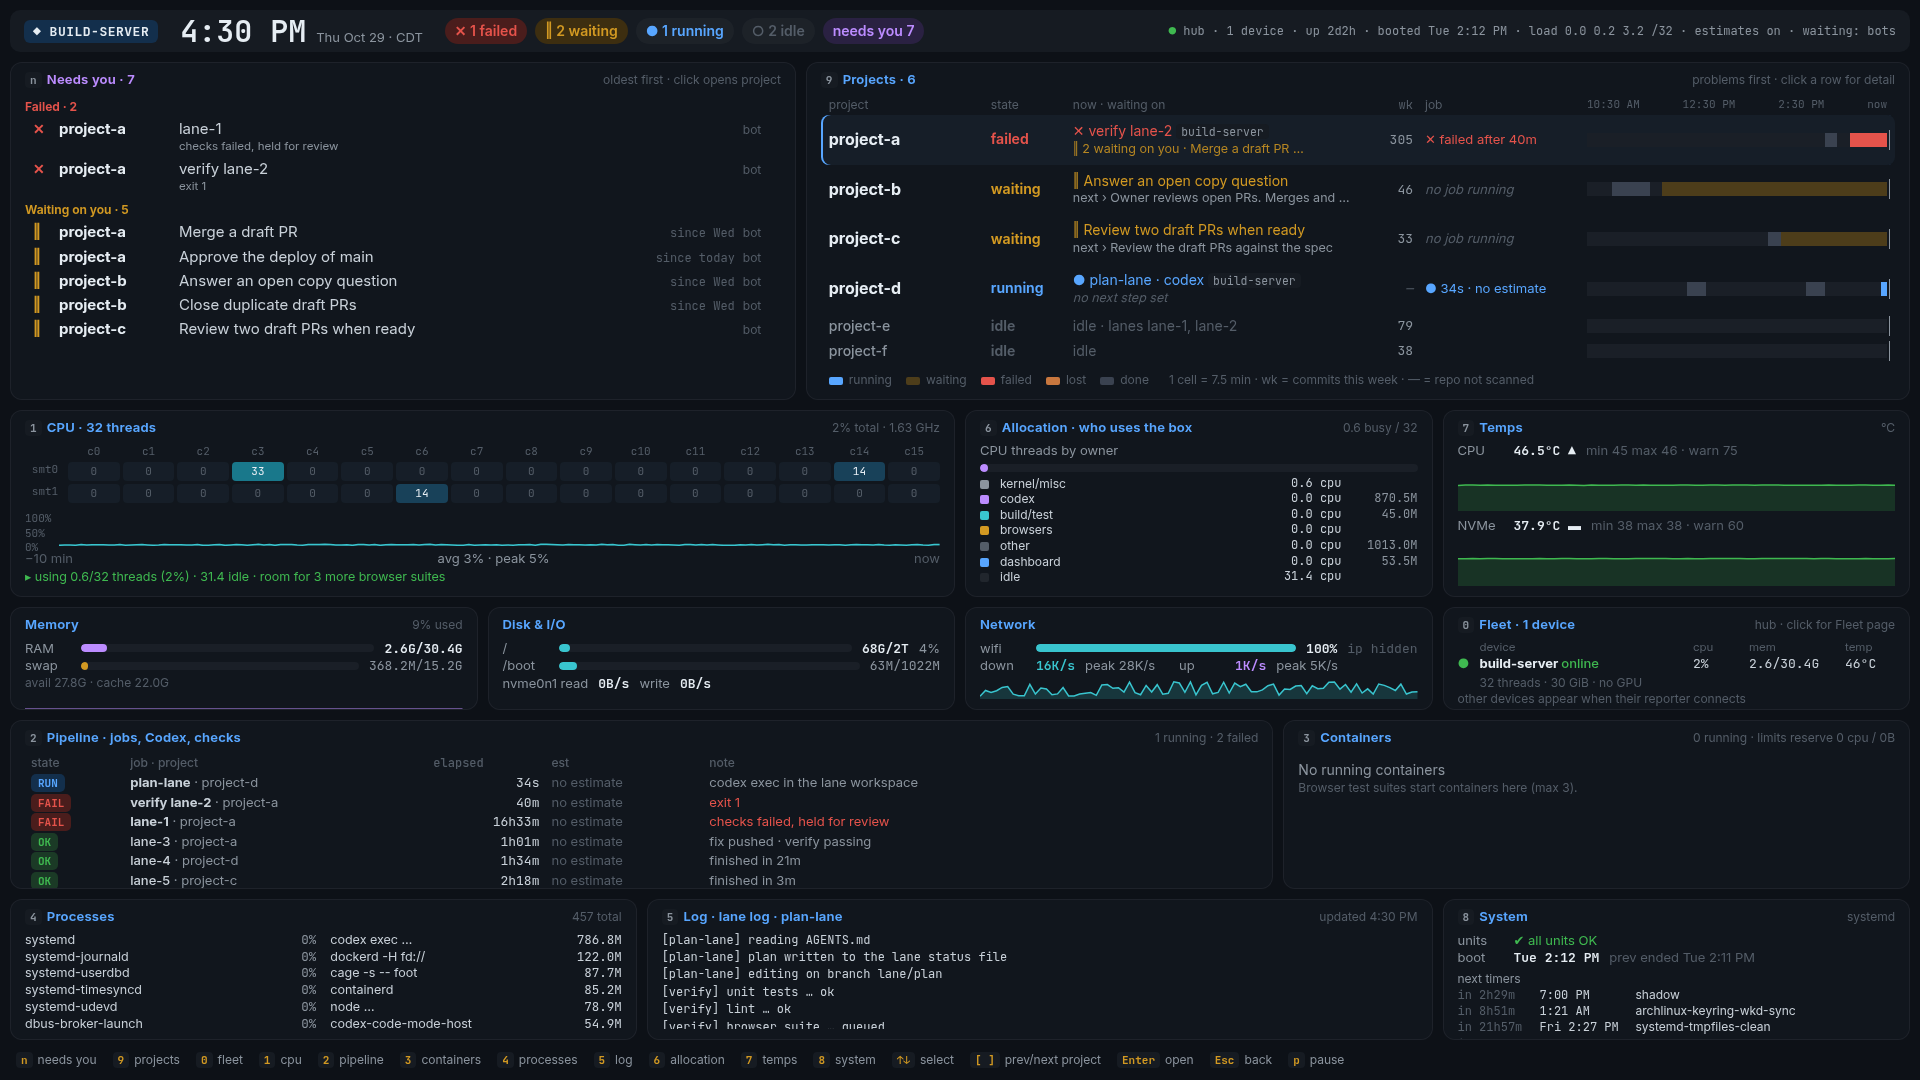
The monitor hub watches every project my coding agents work on. For each one it shows the current state, the jobs that are running and how long they’ve taken against their estimate, any checks that failed, and anything that’s waiting on me. It also shows the devices that run the work, including the build server.
It doesn’t start or stop anything. It reads state and shows it, so I can see what needs attention without opening each repo.
Problems first
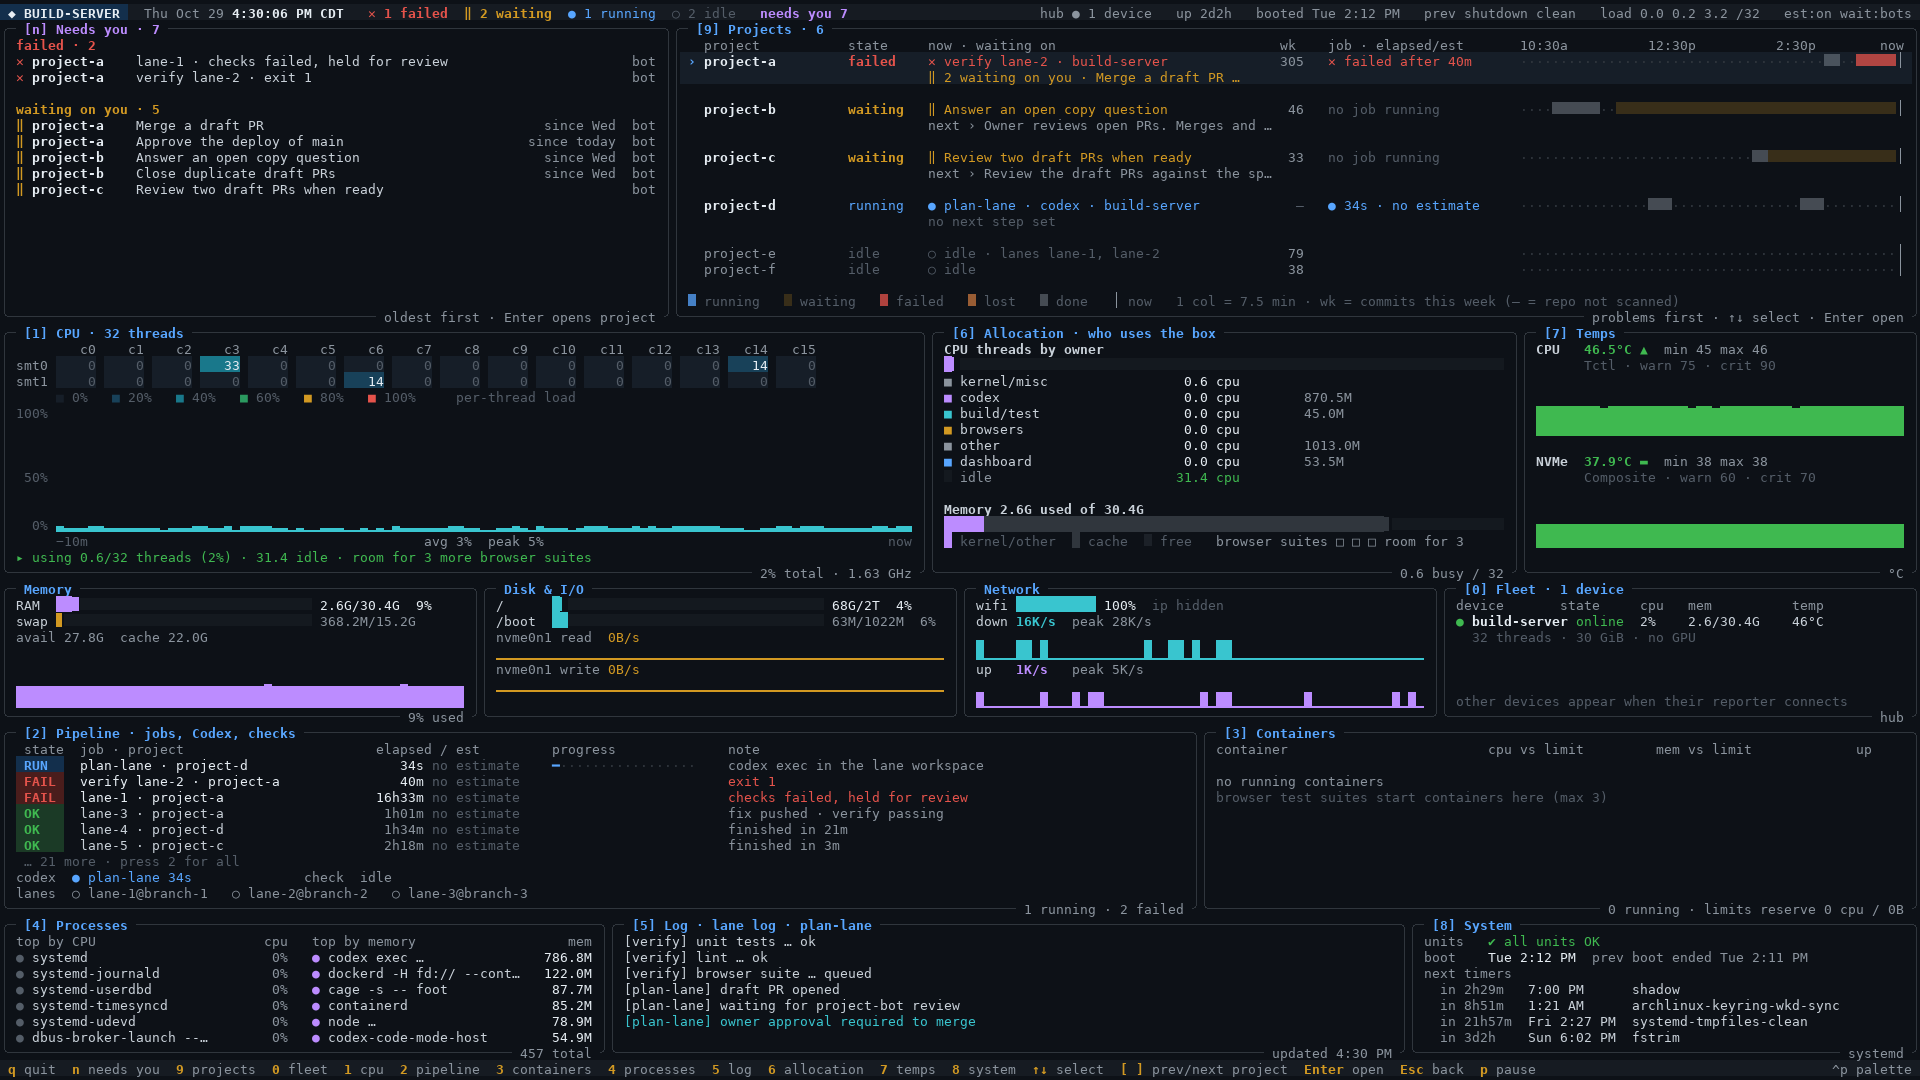
The board is sorted by what needs attention. Needs you comes first, with failed items at the top, then reviews, approvals and open questions. Projects follow in the same order: failed, then waiting, then running. Idle projects collapse into one dim line.
Each state is an icon plus a word, so it doesn’t rely on color alone. Running jobs show elapsed time against their estimate, and the bar turns amber once a job runs past it. Nothing blinks.
Web board and wall console
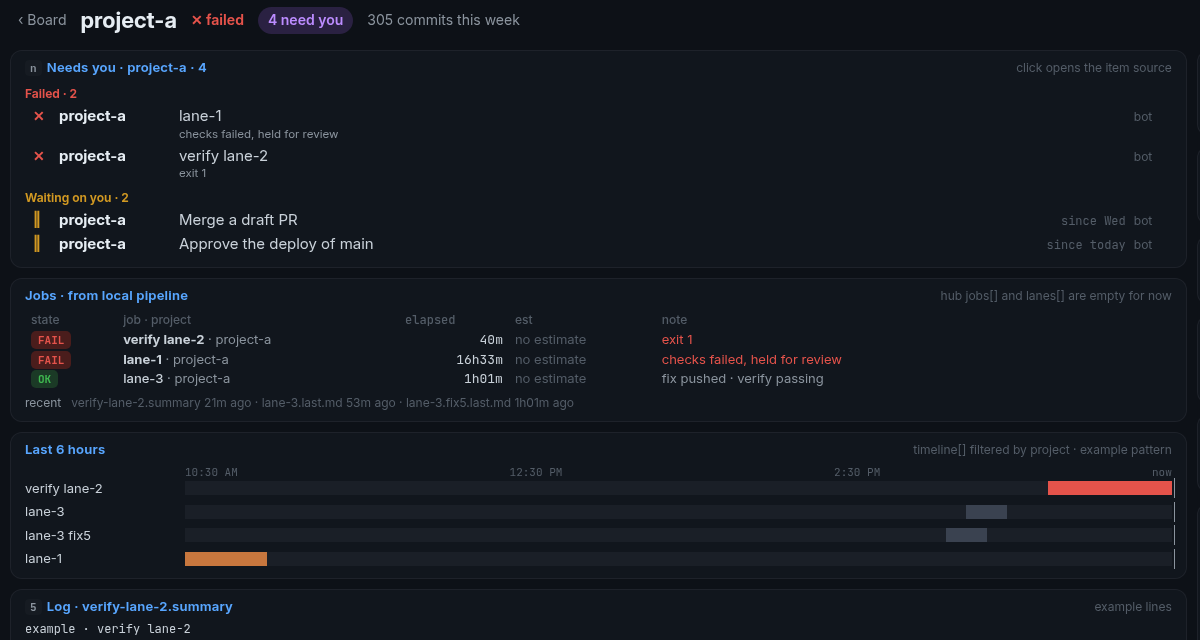
The same board runs in two places: as a web page I can open from any device, and as a terminal console, built with Textual, on a monitor on the wall. Selecting a project opens its detail view, with its lanes, jobs and history.
 ↗
Model routing
Each job is routed to a model tier. Simple jobs, like a commit message, a log summary, labels or a lint fix, go to a local model through Ollama on one of my own machines. Complex jobs, like code changes and reviews, go to a hosted coding agent such as Codex.
The hub tracks usage against each hosted plan’s limit. When a plan runs low, routing shifts more work to local models, and the board shows which way each recent job went.
The fleet
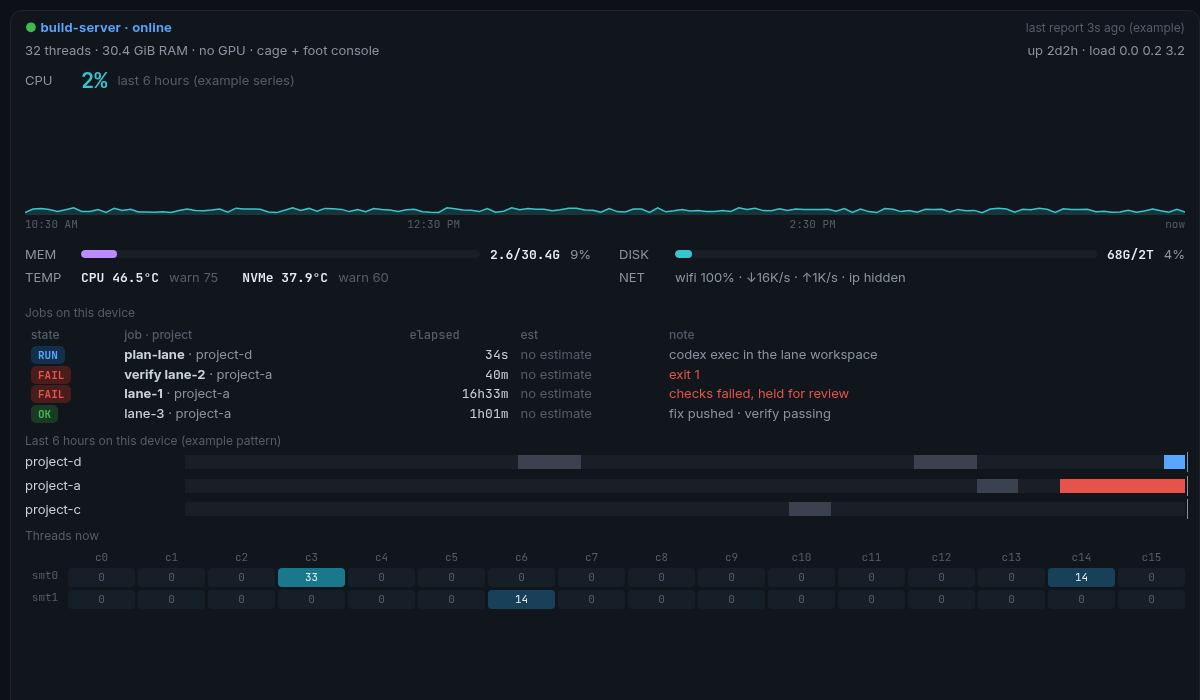
The fleet is three machines: a build server with a Ryzen CPU and no GPU, a desktop with an RTX GPU, and an Apple M1 Max laptop. For each one the hub shows whether it’s online, its CPU, memory and temperature, GPU use and VRAM where there is a GPU, and what it’s running right now.
Most builds, checks and coding-agent runs go to the build server. Local models run on the GPU machines, so this view shows whether a machine is busy, idle or stuck.
 ↗
How it fits the workflow
Every piece of work runs in its own lane, with one branch, one draft PR and one status file. One verify command decides pass or fail on the build server, and nothing merges or deploys without my approval. The monitor hub is how I follow all of that: lanes running in parallel, checks as they finish, and the approvals waiting on me.
Screenshots are design renders with project names, hosts and details changed. Not live data.